My Campaign Strategy was
Based on an analysis using a tool (let's call it a model) I developed to estimate electability using historical voter data and adjusting with estimates of alternative voter turnouts, we had a plan to win. Our plan was as follows:
- Reach out to Republicans who have not been actively voting and convince them to get out and vote. This was handled by the Republican party so we did not spend time or resources on that.
- Reach out to non-Republicans who DO vote and who most-likely share our values and encourage them to vote for us.
- Reach out to non-Republicans who DO NOT vote but most-likely share our values and try to convince them to vote for us.
The model can predict vote percentages not only for the county as a whole but for each Legislative and Senate District within the county as well. When data for a Legislative or Senate District is provided, it breaks its predictions down to the precinct level. The idea is to identify areas where the candidate can put in additional work to try to increase voter turnout.
In the discussion below, the party ratios are defined as follows. These ratios are calculated for the active voters in the candidate's district.
- Republican ratio = (active republican voters + (active voters who are not republican or democrat)/2) / total active voters
- Democrat ratio = (active democrat voters + (active voters who are not republican or democrat)/2) / total active voters
Election Results
Obviously we did not win. Looking at the 2024 General Election results for Bernalillo County it appears that voters voted along straight party lines with little variation. This is evident by consistent percentages of votes cast for candidates across all races in Bernalillo County. The percentage is roughly 60% for the Democrat and 40% for the Republican county wide. It does vary by race, sometimes substantially, in correlation with the different percentages in the candidate's district.
As a side note, my model can predict State Level results as well if voter history data for the state is provided. Since I am in Bernalillo County I fed it Bernalillo County data.
So, what happened?
The most striking thing I noticed in the results were the percentages of the votes for each candidate that seemed to be independent of candidate efforts to reach out to voters. There was some variation in percentages but not according to how much or how little effort and money the candidate put into their campaigns. Based on this observation I suspect party affiliation played the biggest, if not the only significant role in the election results.
So I used my model to quickly look at the proportions of party affiliations for the voters in county wide, Legislative Districts, and Senate Districts to see if there is a correlation between the percentage of votes cast for each candidate and the relative party ratios (as defined above). There does appear to be a correlation between candidate results and the party ratios.
My model provides the following input parameters. Since I am a Republican, these are all from a Republican party perspective. Given that I am evaluating how well my model fits the actual election results, I tweaked the imput paramaters accordingly. I found a relatively good fit with the input parameters set as listed below. Of course, it is difficult to guess parameter values up front and relatively easy to make adjustments after the fact.
Bernalillo County Wide
For Republican candidates with county wide voters, the model predicts that they will get 40% of the Bernalillo County vote. The actual results for the Republican candidates are as follows. Again, these are percentages for the voters within Bernallio County only.
By Legislative District
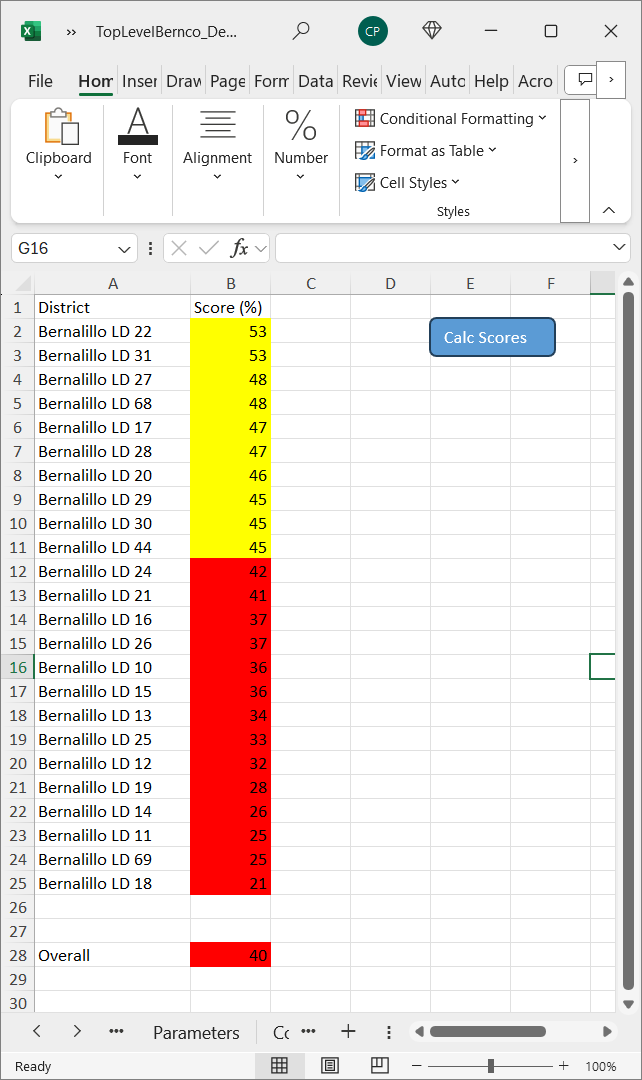
It is most illustrative to present these results using a screen capture from my model. Please compare these predicted results with the actual 2024 General Election results for Bernalillo County. The Score% is the predicted percentage of votes for the Republican candidate.
By Senate District
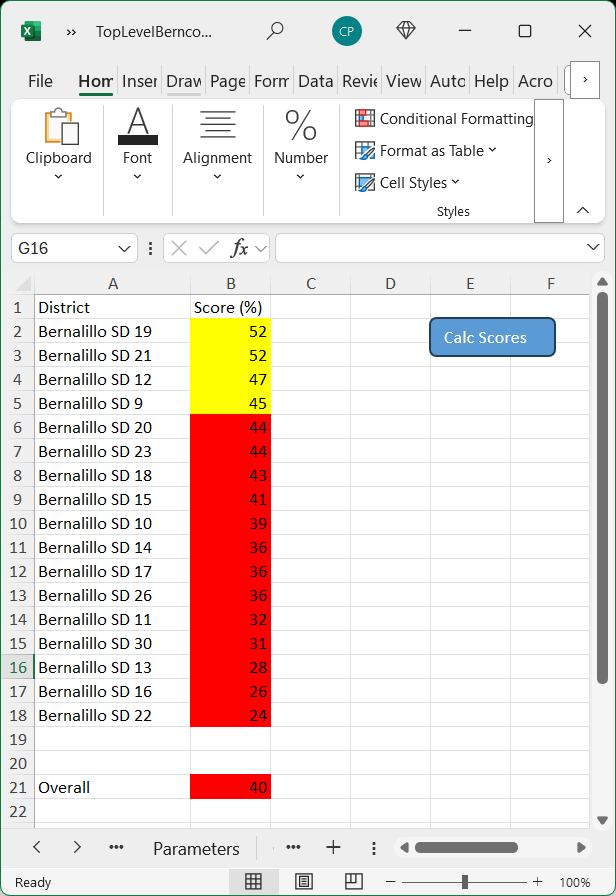
It is most illustrative to present these results using a screen capture from my model. Please compare these predicted results with the actual 2024 General Election results for Bernalillo County. The Score% is the predicted percentage of votes for the Republican candidate.
It should be noted that other factors are involved, like name recognition, but these seem to be within a one or two percentage range from the party ratios (as defined above).
Suggested strategy for future elections
Party leaders strongly encourage candidates to work their tails off knocking doors to convince people within and outside of their party to vote for them. This is independent of efforts to get out the vote. If I am right, the most-cost effective strategy for future candidates in a district where their party affiliation is in the minority is probably not to spend time or money trying to convince people to vote for them. Instead, I think the most-effective approach to winning elections is to spend time and money year-round convincing people to join your party and then get these people out to vote during elections.
So, what is a local candidate to do when the odds are against them? Unless our political climate becomes less divided, perhaps the only practical approach is to just put up an inexpensive campaign website where people who are already interested can go to learn more about you. That is it. Other than that, I do not think spending your time, your money, and other people's money trying to convince people to vote for you will change the results of the election.
An exception would be if a candidate is in a location where the party ratios (as defined above) are within one or two percentage points of 50%. In that case it might make sense to put in

